25 May 2017
MIT Technology Review in partnership with Google Cloud has published a comprehensive report establishing Return On Investment (ROI) from Machine Learning initiatives based on 375 respondants representing equal measures of startups, SME businesses, and large 3,000+ employee organizations. The report goes by the title - Machine Learning: The New Proving Ground for Competitive Advantage.
You can download the report from MIT Technology Review website.
The report reveals that while the majority of businesses are struggling to apply machine learning, others are hard at work developing strategies for the technology — and are already realizing genuine ROI
Key themes emerging from the survey include the following.
Machine Learning NOW. More than 60% respondants have a machine learning implementation. Top 30% are considering themselves at mature stage with their machine learning initiatives.
Machine Learning Competitive Advantages. A quarter of the respondants have acheived competitive advantage from machine learning implementation. Most respondants believe that key benefit of machine learning is gaining competitive advantage.
Machine Learning Investment. Top quarter of respondants spend more than 15% of their IT budgets on machine learning initiatives. This is significant.
Early Adoption = Highest Benefits. This one is obvious, early adopters gain their most desired benefits from machine learning. Nearly half of respondants meet their top goal. Most respondants vote their top goal as better data insights and analytics.
Broad Applicability. Most common projects include image recognition, classification, and tagging, emotion/behaviour analysis, text classification and mining, and natural language processing (NLP).
Need help determining machine learning ROI for your business? Just send us a message and we will respond.
17 May 2017
Property portals can list thousands of properties at a time. How do you as the portal manager analyze the performance of your listings to increase user conversion? How do you as a real-estate agent optimize a property listing so it delivers the best results?
We use Speedml to analyze this problem. We are participating in the Kaggle competition hosted by Two Sigma Connect. The competition is for their Renthop property listings portal. The problem we solve is How much interest will a new rental listing on RentHop receive? as the competition website describes.
Speedml solution reaches top 20% of around 2,500 participating teams and data scientists. We achieve this with more than 70% reduction in iterations when compared with top solutions.
The datasets for this competition are available from Kaggle website or Renthop on request (academic, research use).
Multi-notebook workflow
This project involves significant number of features (200+) and lot of data or nearly 125,000 samples across train and test datasets. Processing such large dataset requires significant compute during our workflow on a laptop. We decide to split the workflow into workflow stage-specific notebooks, saving interim datasets at each stage.
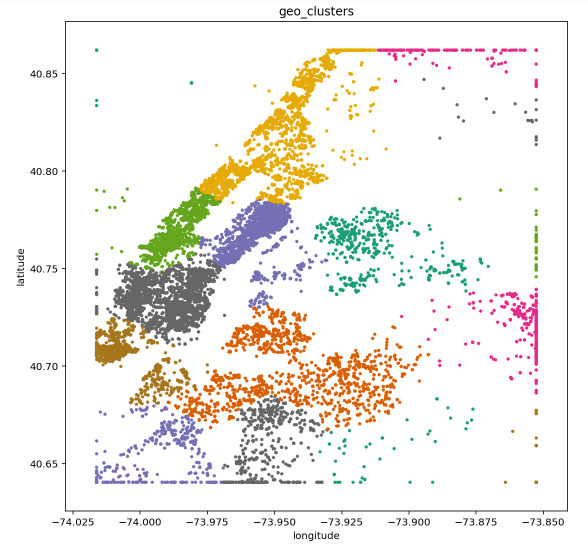
EDA and Wrangle. During this stage we understand the datasets by running exploratory data analysis. During this stage we also visualize location-based features including latitude and longitude of the property location using clustering techniques.
We also perform basic data pre-processing and wrangling by feature engineering density for high-cardinality features, labels for categorical text features, and outliers fixing, among other aspects.
This stage saves a feature engineered interim dataset for train and test scenarios.
High-cardinality. Next stage further processes certain high-cardinality features based on their correlation with the target variable. This stage is processing intensive so we separate it out and save the results as train and test datasets which handle high-cardinality.
Text processing. We also dedicate a notebook to perform text processing on free-form text fields like property listing description.
Model prediction. Final stage in our workflow builds on top of work done in other stages and generates the model training and prediction.
Speedml solution
Speedml experts have significant experience working on leading property portals including one of UK’s largest property listing portals.
Speedml property listing optimization solution will take as input the sample dataset (simple CSV format) describing your property portal listings or we can provide a sample dataset.
The result will be a set of data analytics reports, charts describing your dataset, and of course machine learning model results based on certain assumptions around user behaviour. You can change these assumptions later to tailor the solution for your business as your user base grows.
Deliverable includes custom data science solution notebook you can run from your laptop, or hosted from private GitHub.
As your user base grows you can feed actual data to the model (as simple as copying a CSV into a folder) and see how this changes the model predictions.
We will develop the solution using the open source Speedml and best-of-breed machine learning packages, which are well documented and community supported.
If you require a custom solution for your property portal please send us a message and we will respond.
13 May 2017
Data science workflow can be iterative and take circutous paths. What futher adds to this complexity is leaving the memory to the data scientist, of how the workflow progresses over the course of a project.
Speedml memorizes the data science workflow for the data scientist.
It does so using the simple Speedml.eda method. In this release 0.9.2 we further optimize the method making it user configurable and progressively updating based on the workflow status.
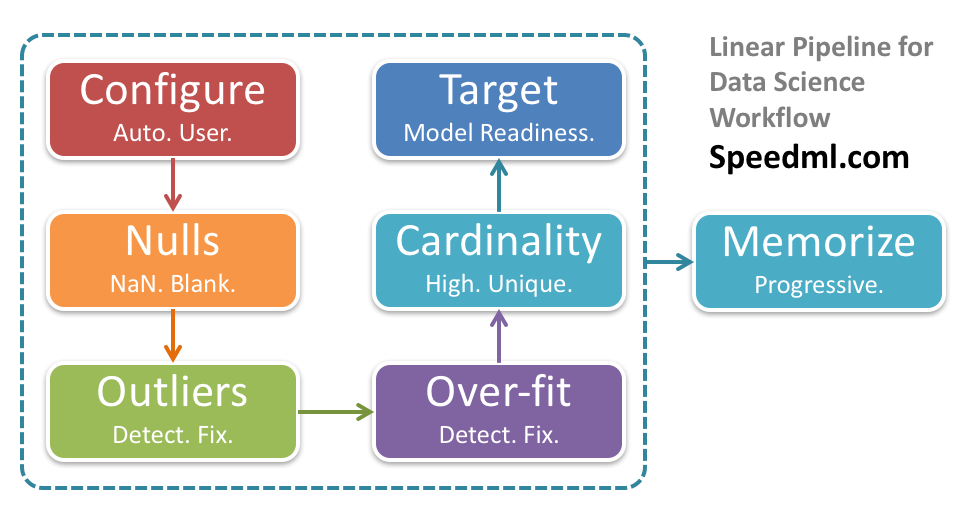
Progressively updating workflow status
Now when you call Speedml.eda method at the start of your workflow, during pre-processing, and before model run, it returns a table which progressively hides away the metrics which are complete.
Within the same notebook you can scroll to prior or next EDA result to note the changes based on your workflow steps.
This ends up making the call the Speedml.eda akin to an automatically updating to do list.
See how this feature works in the notebook Titanic Solution Using Speedml from our GitHub repository.
Pipelining from EDA to pre-processing
The Speedml.eda method now returns a list of features instead of tuples with cardinality. This helps in taking the cell output straight into pandas dataframe filter or feature engineering methods like feature.density or feature.labels for next stage workflow.
Cardinality is still available for three bands - high, normal (within threshold), and continuous or unique. For most workflows this information is enough.
Following code demonstrates how we can pipeline results from the Speedml.eda method into the next stage in our workflow for pre-processing the features.
# Display top 5 samples with text unique features
sml.train[sml.eda().get_value('Text Unique', 'Results')).head()

# Convert categorical text features to numeric labels
text_categoricals = sml.eda().get_value('Text Categorical', 'Results')
sml.feature.labels(text_categoricals)
The Speedml.feature.density method now takes string feature name or a list of strings of feature names as parameter to create density features for one or more high-cardinality features. This way you can now pipe the eda method’s high-cardinality features list to the density method like so.
# Create density features for High-cardinality text features
text_high_cardinality = sml.eda().get_value('Text High-cardinality', 'Results')
sml.feature.density(text_high_cardinality)
That is easy.
User configurable EDA rules
Speedml EDA rules are now configurable using the API. You can configure how Speedml analyzes outliers, over-fitting, high-cardinality, unique or continuous features.
# Display the configuration dictonary
sml.config
# Used by data out path 'internally' within Speedml methods
sml.configure('outpath', 'output/')
# Positive and negative skew within +- this value
sml.configure('outliers_threshold', 3)
# #Features/#Samples Train < this value
sml.configure['overfit_threshold'] = 0.01
# Feature is high-cardinality if categories > this value
sml.configure('high_cardinality', 10)
# Unique (continuous) if sml.config('unique_ratio')% non-repeat values
sml.configure('unique_ratio', 80)
Of course Speedml sets up the natural defaults so you do not have to.
# Display the configuration dictonary
sml.configuration()
Outlier detection during EDA
The Speedml.eda method now performs automatic outliers detection based on amount of skew of feature values from normal distribution. The outlier detection threshold is user configurable like so.
# Positive and negative skew within +- this value
sml.config('outliers_threshold', 3)
Depending of existance of outliers the Speedml.eda method results suggest usage of upper or lower percentile during Speedml.feature.outlier method call.
12 May 2017
Exploratory Data Analysis (EDA) is one of the first workflows when starting out a machine learning project. Throwing in a bunch of plots at a dataset is not difficult. What is much more useful is to derive insights, metrics, and observations based on the state of the datasets, guiding next stages in our ML workflow.
The 0.9.2 release of Speedml focuses on productivity improvements during exploratory data analysis workflow.
Can the datasets tell us which plots to use to detect outliers, which features to engineer next, which model algorithms to use, or how to cleanse our datasets? This release of Speedml starts answering some of these questions for you.
We also address Python 2.x / 3.x compatibility issues and current bug fixes.
Speed EDA
Once you have imported Speedml and initialized the datasets, you can run the eda method to speed EDA your datasets.
from speedml import Speedml
sml = Speedml('../input/titanic/train.csv',
              '../input/titanic/test.csv',
              target='Survived', uid='PassengerId')

sml.eda()
The resulting dataframe automatically provides insights and observations based on current state of your datasets. Observations include suitable plots to use, pre-processing methods to apply, and ideal results to achieve for model readiness. We even include model recommendations (regression or classification) based on the target variable analysis.
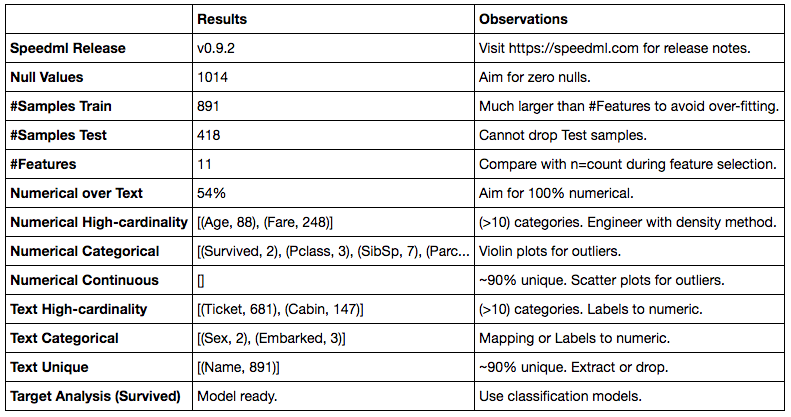
As you progress in the pre-processing workflow you can run the method again and it will tailor the result according to latest state. Once you convert all text columns to numerical, the text features related rows will disappear. Think of this method as a dashboard of progress throughout your workflow.
You can query any of the results like so.
sml.eda().get_value('Numerical Categorical', 'Results')
This will output the complete text or list value of the results column for the queried metric.
New plots
We are adding a couple of new plots in this release.
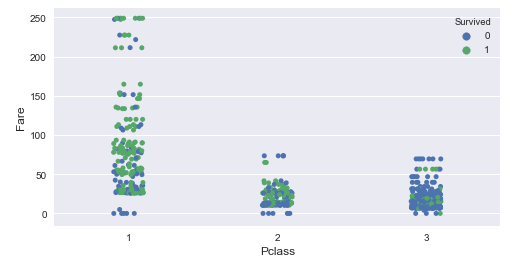
Using Strip plots we can plot categorical feature against a continuous feature across the target variable.
sml.plot.strip('Pclass', 'Fare')
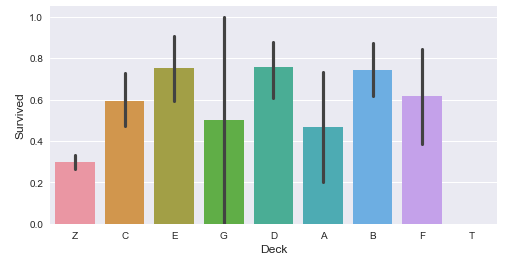
We can plot categorical variables against target variable using a simple bar graph.
sml.plot.bar('Deck', 'Survived')
Plot this right next to a crosstab table using plot.crosstab method to gain a text based and visual view of the same data.
Automatic notebook configuration
init.py Revert to using absolute/relative paths as passed into public API. Use Base.outpath for internal file output (when storing Xgb feature map file).
Now you do not need to specify %matplotlib inline magic command in the notebook using Speedml. We configure the notebook automatically.
Capability to output more than one results from one input cell. Nice to have when using single line method calls returning single line results. Specially when these methods can group as one seamless workflow like so.
sml.feature.extract(new='Title', a='Name', regex=' ([A-Za-z]+)\.')
sml.plot.crosstab('Title', 'Sex')
sml.feature.replace(a='Title', match=['Lady', 'Countess','Capt', 'Col',\
'Don', 'Dr', 'Major', 'Rev', 'Sir', 'Jonkheer', 'Dona'], new='Rare')
sml.feature.replace('Title', 'Mlle', 'Miss')
sml.feature.replace('Title', 'Ms', 'Miss')
sml.feature.replace('Title', 'Mme', 'Mrs')
sml.train[['Name', 'Title']].head()
This code in one input cell will now output a series of dataframes and string messages based on output from each of the methods.
Python 3 and 2 compatible support
base.py Added @staticmethod decorator for data_n() method to address #8
setup.py Added dependency for future package to support Python 3/2 compatible code.
setup.py Updated open method without encoding param for Py27 compatibility.
From this release we are adding release testing and feature exploration notebooks for Python 3.x and Python 2.x kernels. You can view and download these from GitHub for 0.9.2 release running for Python 2.x or 3.x kernels.
We can now save metrics from model performance methods as a file slug as part of our submission. This enables us to record and order submissions by changes to these metrics.
sml.save_results(
    columns={ 'PassengerId': sml.uid,
             'Survived': sml.xgb.predictions },
    file_path='output/titanic-speedml-{}.csv'.format(sml.slug()))
This results in file names like these.
titanic-speedml-e16.63-m83.33-s86.53-f78.73.csv
Here the CV error is e=0.1663. Model accuracy relative to other models is m=0.8333. Accuracy of number of samples predicted is s=86.45%. The feature selection accuracy score is f=78.73%.
06 May 2017
The Speedml release 0.8.1 and 0.9.0 are focusing on documentation and consistent API related changes.
The API documentation is available on PyPi website.
Changes to existing API
feature.regex_extract We are renaming to a simpler alternative feature.extract making use of the prefix to signify the method. Of course the parameter is still called regex so we know how we are extracting the feature.
feature.ordinal_to_numeric This method was incorrectly named in release 0.8.0 as it operates on categorical features regardless of these being ordinal. We now call the methond mapping signifying it can take more general use cases. We still recommend using this method sparingly when you have 2-5 categories. You should consider the feature.labels method as a first preference alternative in most cases.
outliers_fix is renaming to outliers as the feature. prefix indicates feature engineering aspect for the method.
crosstab is now part of plot.crosstab API instead of core Speedml. We are treating plot component generally for EDA including dataframes as outputs as well as charts.
sample_accuracy is now appropriately part of Xgb component as it returns accuracy specific to XGBoost model.
Created Model component. Renamed and moved model.data, model.evaluate, model.ranks to the new component.
Moved feature_selection to Xgb component as it returns feature thresholds and accuracy for XGBoost model.
return values are now more consitent and return printable strings or dataframes which can output directly to a Notebook. The print method is applicable when returning strings during a loop to determine progress, like in case of the feature_selection method.
Supporting the API
We also went live with the Speedml.com website detailing API documentation and use cases.
We are updating the Speedml notebooks to include the latest API. We are also adding shorter single feature notebooks as demos for the Speedml linear workflow.