Plot Correlation Of Features
06 May 2017During a supervised machine learning project, understanding how dataset features correlate among each other or with the target variable, is an essential aspect of exploratory data analysis (EDA) workflow.
This article documents Speedml.plot.correlate method, describes how we have coded this method, and how you can use this in your machine learning projects.
The Speedml documentation describes the method this way.
Plot correlation matrix heatmap for numerical features of the training dataset. Use this plot to understand if certain features are duplicate, are of low importance, or possibly high importance for our model.
Minimal prerequisites
Two Speedml prerequisites for calling this method are (1) that we load the datasets and, (2) there are numerical features within the dataset. These minimal prereqisites make this one of the first EDA plots you can call to understand the given datasets.
sml = Speedml('train.csv', 'test.csv',
              target='Survived', uid='PassengerId')
sml.shape()
As an example, the default Titanic dataset contains 6 numerical features to start with, including the target Survived feature.
Shape: train (891, 11) test (418, 10)
Numerical: train_n (6) test_n (5)
Using the correlate method
You can download and run the demo notebook for using this method from GitHub.
Once you have the datasets loaded and uid specified, the correlation plot will ignore the uid feature.
sml.plot.correlate()
This results in correlation plot like so.
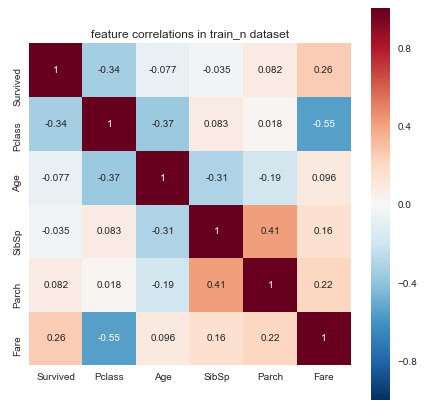
The way to interpret this plot is as follows.
Negative and positive correlations. Negative correlation means features increase or decrease in values in opposite directions on a number line. If one feature increases, the other feature decreases, when they have negative correlation. Positive correlation means features decrease or increase in values together.
Duplicate features. If two features have correlation of one then the features are duplicate.
Feature importance. Higher correlation of features with the target feature indicates possible higher importance of the feature for our model. We can verify this further by running feature importance plots provided in the Speedml package.
How Speedml implements the method
We use pandas.DataFrame.corr method to determine feature correlations. Then we determine the figure size for the correlation heatmap using number of features as a guide.
def correlate(self):
    corr = Base.train_n.corr()
    features = Base.train_n.shape[1]
    cell_size = features * 1.2 if features < 12 else features * 0.5
    plt.figure(figsize=(cell_size, cell_size))
    sns.heatmap(corr, vmax=1, square=True,
                annot=True if features < 12 else False)
    plt.title('feature correlations in train_n dataset');
Speedml then plots the corelation matrix heatmap using the popular Seaborn plotting package.