06 May 2017
During a supervised machine learning project, understanding how dataset features correlate among each other or with the target variable, is an essential aspect of exploratory data analysis (EDA) workflow.
This article documents Speedml.plot.correlate method, describes how we have coded this method, and how you can use this in your machine learning projects.
The Speedml documentation describes the method this way.
Plot correlation matrix heatmap for numerical features of the training dataset. Use this plot to understand if certain features are duplicate, are of low importance, or possibly high importance for our model.
Minimal prerequisites
Two Speedml prerequisites for calling this method are (1) that we load the datasets and, (2) there are numerical features within the dataset. These minimal prereqisites make this one of the first EDA plots you can call to understand the given datasets.
sml = Speedml('train.csv', 'test.csv',
              target='Survived', uid='PassengerId')
sml.shape()
As an example, the default Titanic dataset contains 6 numerical features to start with, including the target Survived feature.
Shape: train (891, 11) test (418, 10)
Numerical: train_n (6) test_n (5)
Using the correlate method
You can download and run the demo notebook for using this method from GitHub.
Once you have the datasets loaded and uid specified, the correlation plot will ignore the uid feature.
This results in correlation plot like so.
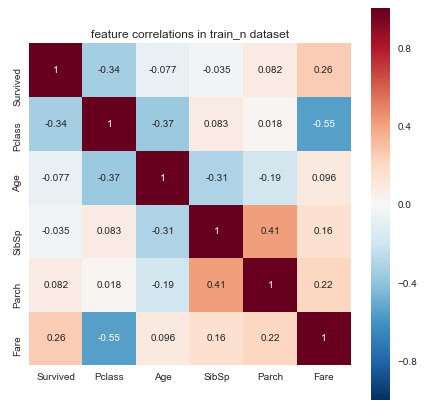
The way to interpret this plot is as follows.
Negative and positive correlations. Negative correlation means features increase or decrease in values in opposite directions on a number line. If one feature increases, the other feature decreases, when they have negative correlation. Positive correlation means features decrease or increase in values together.
Duplicate features. If two features have correlation of one then the features are duplicate.
Feature importance. Higher correlation of features with the target feature indicates possible higher importance of the feature for our model. We can verify this further by running feature importance plots provided in the Speedml package.
How Speedml implements the method
We use pandas.DataFrame.corr method to determine feature correlations. Then we determine the figure size for the correlation heatmap using number of features as a guide.
def correlate(self):
    corr = Base.train_n.corr()
    features = Base.train_n.shape[1]
    cell_size = features * 1.2 if features < 12 else features * 0.5
    plt.figure(figsize=(cell_size, cell_size))
    sns.heatmap(corr, vmax=1, square=True,
                annot=True if features < 12 else False)
    plt.title('feature correlations in train_n dataset');
Speedml then plots the corelation matrix heatmap using the popular Seaborn plotting package.
27 Apr 2017
This release 0.8.0 is our first public release. We nicknamed this release “Flow” as it represents the state we want to reach when coding Machine Learning projects, where we focus on the data, the problem at hand, and the solution, without the API coming in our way.
Here is a list of features in this release categorized by typical ML workflow sequence.
Exploratory Data Analysis
distribute Plot numerical features within training dataset as a set of histograms to understand distributions, skews for features of the dataset at-a-glance.
correlate Plot numerical features within training dataset as a correlation matrix heatmap plot to determine which features are best related to the target and which features may be candidates for engineering or removal. The plot automatically flexes based on number of features, displaying more details for fewer features, and more compact graph for larger number of features.
ordinal Plot ordinal features (categorical numeric) using Violin plot against target feature. Use this to determine outliers within ordinal features spread across associated target feature values.
continuous Plot continuous features (numeric) using scatter plot. Use this to determine outliers within continuous features.
model_ranks Plot ranking among accuracy offered by models based on our datasets.
importance Plot importance of features based on ExtraTreesClassifier.
xgb_importance Plot importance of features based on XGBoost.
Pre-processing and data wrangling
drop Drop one or more list of strings naming features from train and test datasets.
impute Replace empty values in the entire dataframe with median value for numerical features and most common values for text features.
fill_na Fills empty or null values in a feature name with new string value.
replace In feature a values match string or list of strings and replace with a new string.
outliers_fix Fix outliers for lower or upper or both percentile of values within a feature.
density Create new feature named a feature name + suffix ‘_density’, based on density or value_counts for each unique value in a feature.
add Update a numeric feature by adding num number to each values.
sum Create new numeric feature by adding a + b feature values.
And similarly other methods for working on numerical features including diff, divide, product, and round.
Methods to apply concat, list_len for count of items in a list, word_cound for word count in free-text values of features.
regex_extract Match regex regular expression with a text feature values to update a feature with matching text if new = None. Otherwise create new feature based on matching text.
labels Generate numerical labels replacing text values from list of categorical features.
XGBoost model capabilities
hyper Tune XGBoost hyper-parameters by selecting from permutations of values from the select_params dictionary. Remaining parameters with single values in the fixed_params dictionary. Returns a dataframe with ranking of select_params items.
cv Calculate the Cross-Validation (CV) score for XGBoost model based on grid_params parameters. Sets xgb.cv_results variable to the resulting dataframe.
Methods for defining params, classifier, performing model training fit, and to predict the model results.
Speedml workflow
Methods spanning model evaluation, feature selection, and dataset file input/output.